应用截图

详细介绍
Debug your page template to see if it works with Google Tag Manager's auto-event listeners.
The GTM Sonar can be used to debug the page template and its compatibility with Google Tag Manager's listeners.
TABLE OF CONTENTS
1. OVERVIEW
2. HOW TO USE IT
3. TO-DO
4. VERSION HISTORY
--------------------
1. OVERVIEW
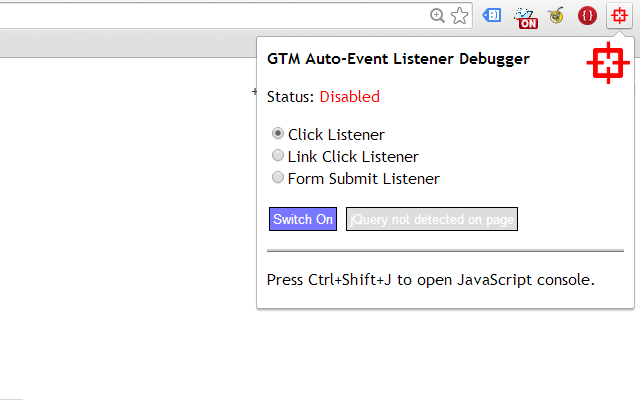
Once you install the extension (and reload your page), clicking the red target in the extension pane will open a pop-up.
In this pop-up, you can choose which listener to activate on the page.
Click Listener: Halts default action of all clicks on the document node, pushes gtm.click and other data into debugDL upon clicking on the page.
Link Click Listener: Halts default action of all clicks on the document node, pushes gtm.linkClick and other data into debugDL upon clicking any link element on the page.
Form Submit Listener: Halts default action of all form submissions, pushes gtm.formSubmit and other data into debugDL upon submitting a form.
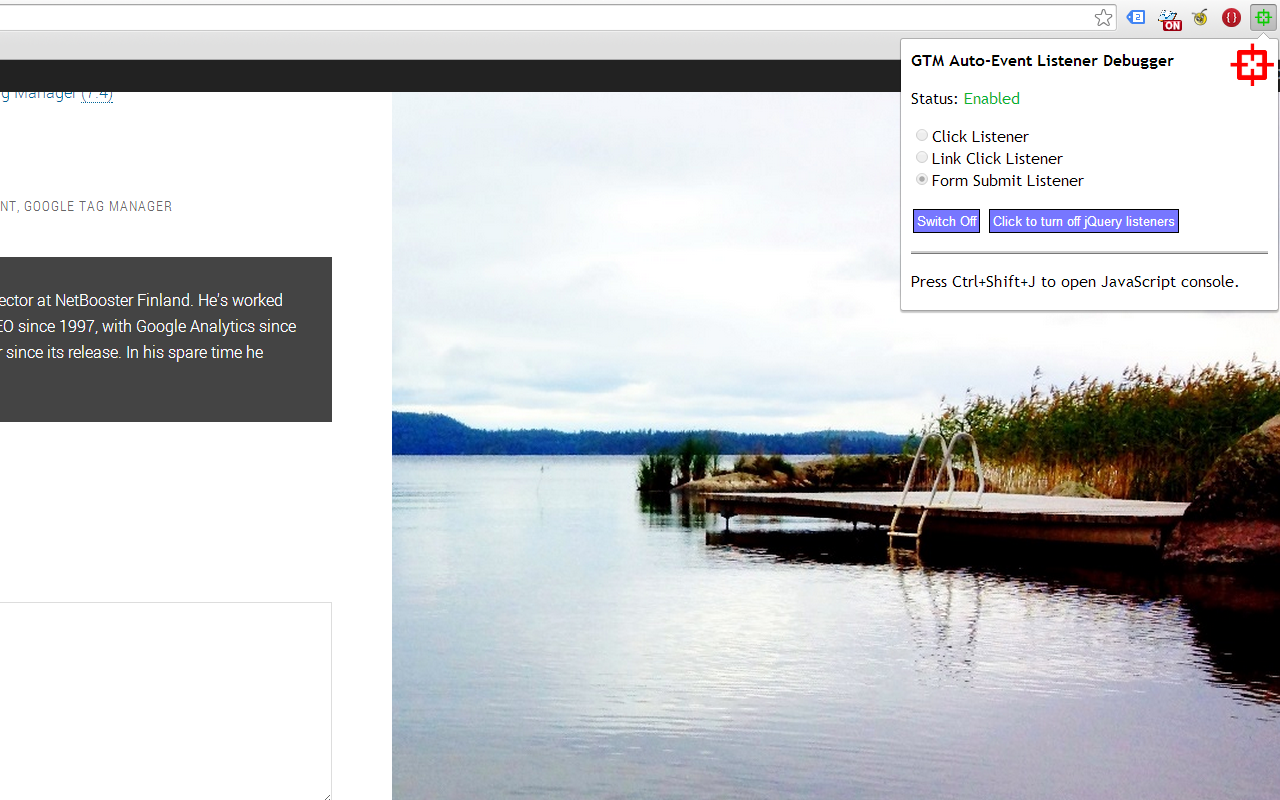
By choosing the listener and clicking "Switch On" you set up the listener on the page. By opening the pop-up and clicking "Switch Off", you cancel all extension actions.
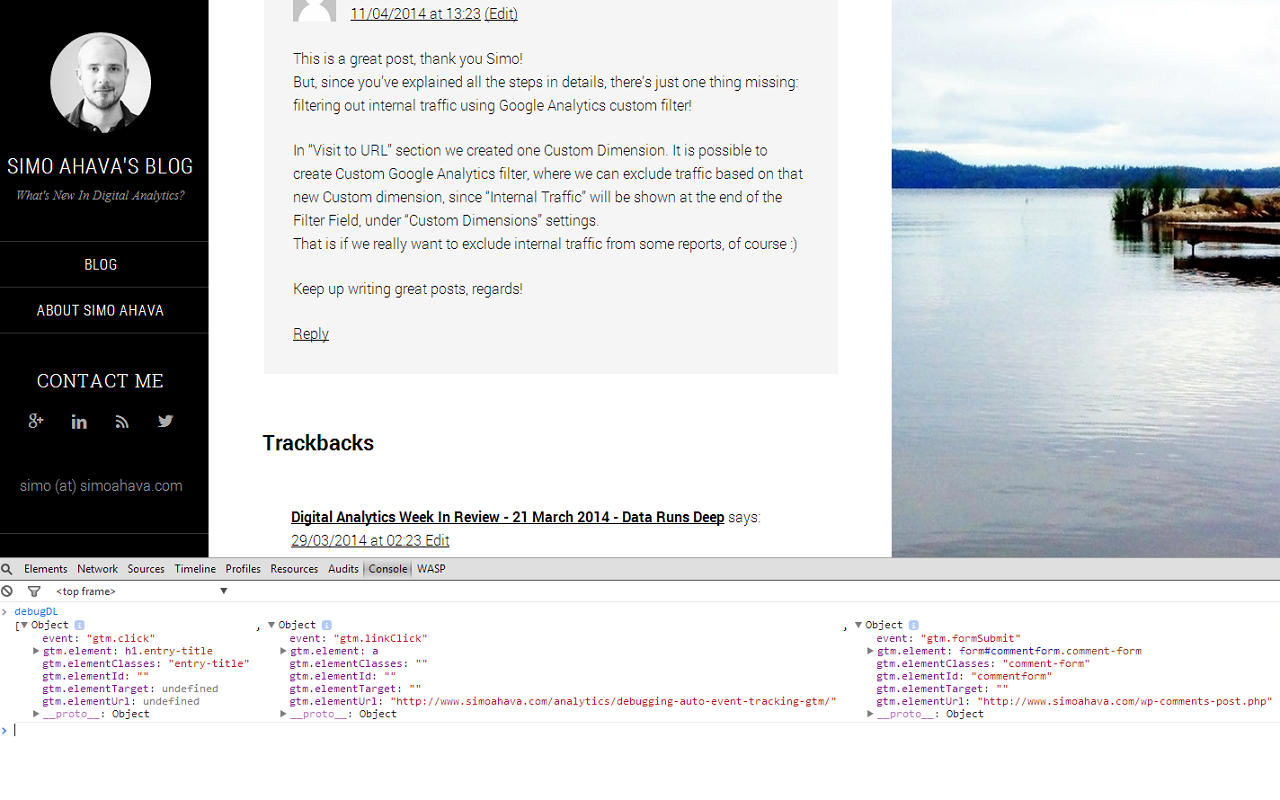
Once an event is pushed into the debugDL array, a small badge icon in the Browser Action increases in count, signifying the number of items in the array. To view contents of the array, open the JavaScript console in your Chrome browser and type "debugDL" (without quotes).
If your page has jQuery available, you can kill all jQuery binds by clicking the respective button. This is to test if jQuery is interfering with GTM listeners.
The debugger is tab-specific, so actions in a tab are for that tab only. Once you browse away from the page, debugDL will not be available any more.
Note that canceling the default action of clicks and submits is not 100 % accurate. You might have interfering scripts which make it so that redirection or submission happens anyway.
2. HOW TO USE IT
The idea is that you can test how different elements perform with t
The GTM Sonar can be used to debug the page template and its compatibility with Google Tag Manager's listeners.
TABLE OF CONTENTS
1. OVERVIEW
2. HOW TO USE IT
3. TO-DO
4. VERSION HISTORY
--------------------
1. OVERVIEW
Once you install the extension (and reload your page), clicking the red target in the extension pane will open a pop-up.
In this pop-up, you can choose which listener to activate on the page.
Click Listener: Halts default action of all clicks on the document node, pushes gtm.click and other data into debugDL upon clicking on the page.
Link Click Listener: Halts default action of all clicks on the document node, pushes gtm.linkClick and other data into debugDL upon clicking any link element on the page.
Form Submit Listener: Halts default action of all form submissions, pushes gtm.formSubmit and other data into debugDL upon submitting a form.
By choosing the listener and clicking "Switch On" you set up the listener on the page. By opening the pop-up and clicking "Switch Off", you cancel all extension actions.
Once an event is pushed into the debugDL array, a small badge icon in the Browser Action increases in count, signifying the number of items in the array. To view contents of the array, open the JavaScript console in your Chrome browser and type "debugDL" (without quotes).
If your page has jQuery available, you can kill all jQuery binds by clicking the respective button. This is to test if jQuery is interfering with GTM listeners.
The debugger is tab-specific, so actions in a tab are for that tab only. Once you browse away from the page, debugDL will not be available any more.
Note that canceling the default action of clicks and submits is not 100 % accurate. You might have interfering scripts which make it so that redirection or submission happens anyway.
2. HOW TO USE IT
The idea is that you can test how different elements perform with t