应用截图
详细介绍
Instantly see live experiments, feature flags, and personalization campaigns on your site and verify everything is firing correctly.
Whether you’re a developer, QA engineer, or optimization specialist, the Kameleoon Chrome extension gives you the tools to troubleshoot issues, confirm behavior, and debug live Kameleoon activity without leaving your browser.
What you can do:
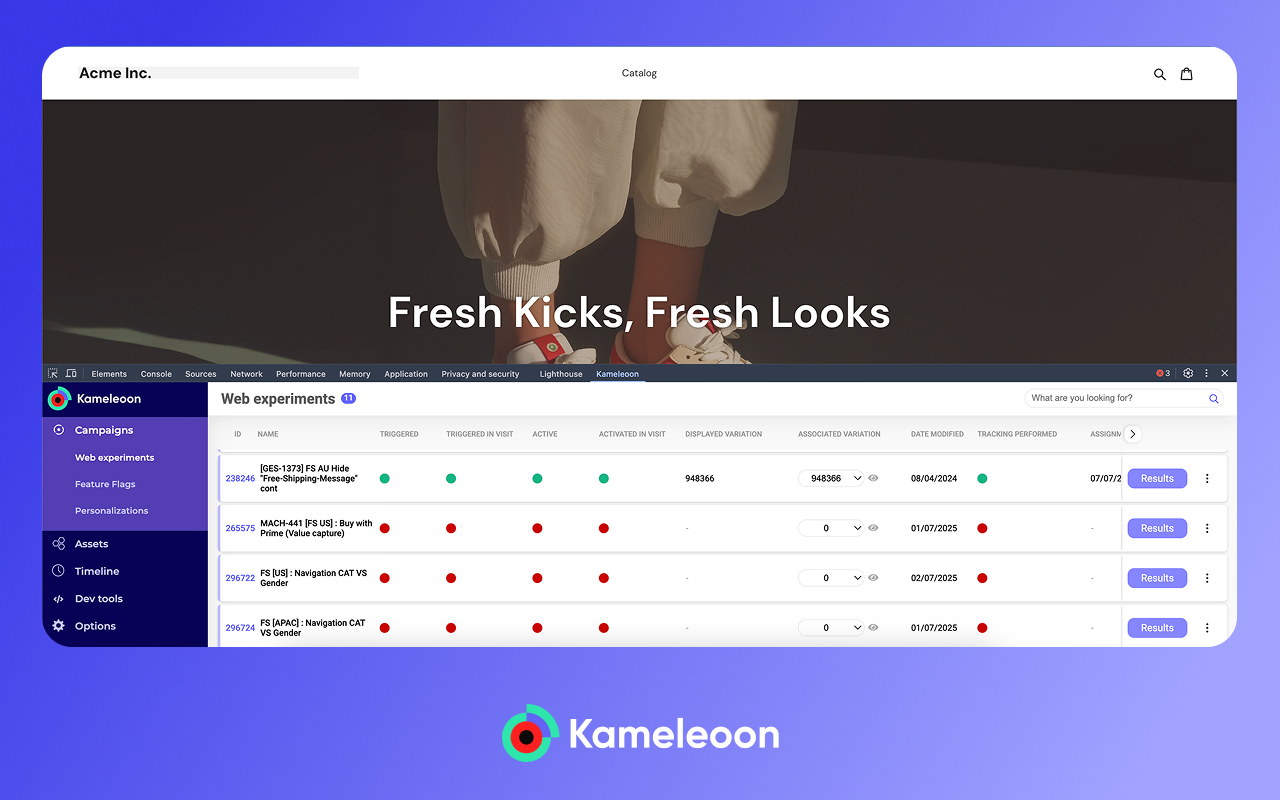
🔍 Instantly view active experiments, feature flags, and personalization campaigns — and see which variation you’re bucketed into on any page.
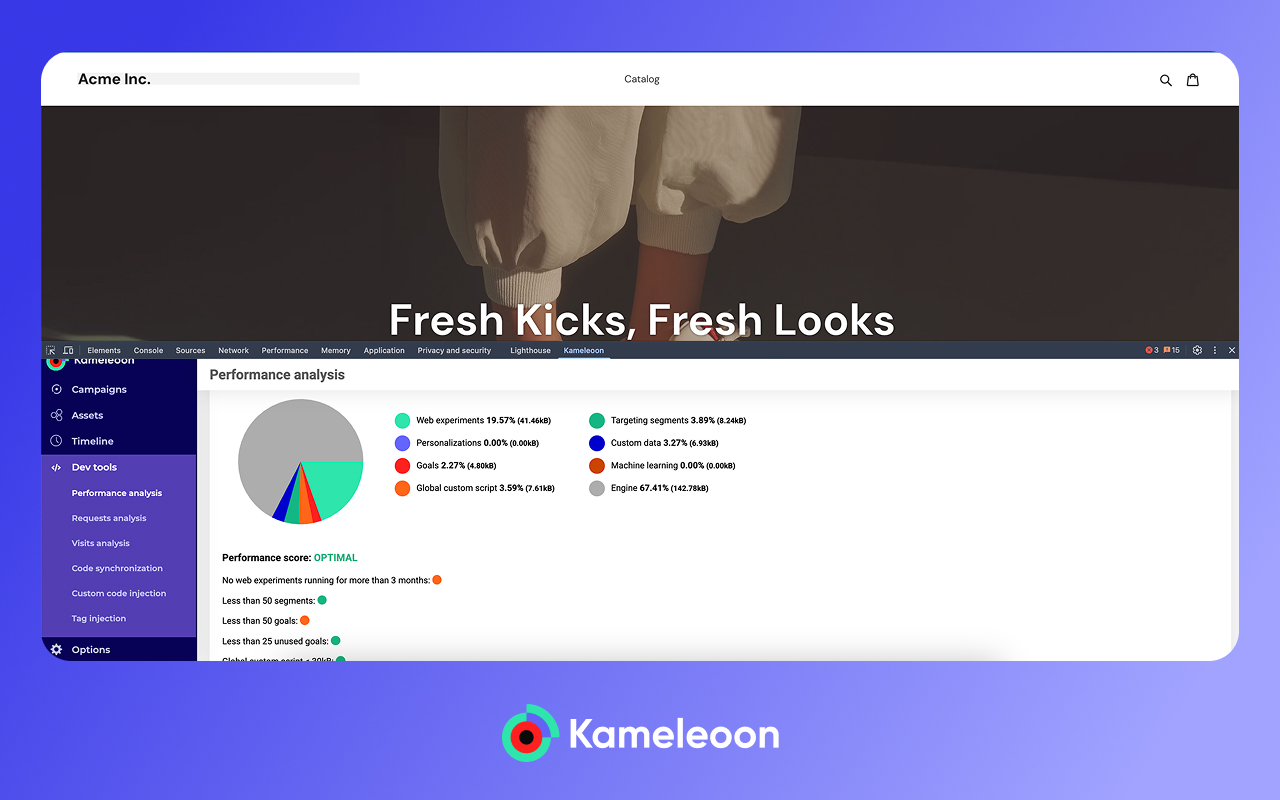
📦 Check script size and understand the performance impact of each component.
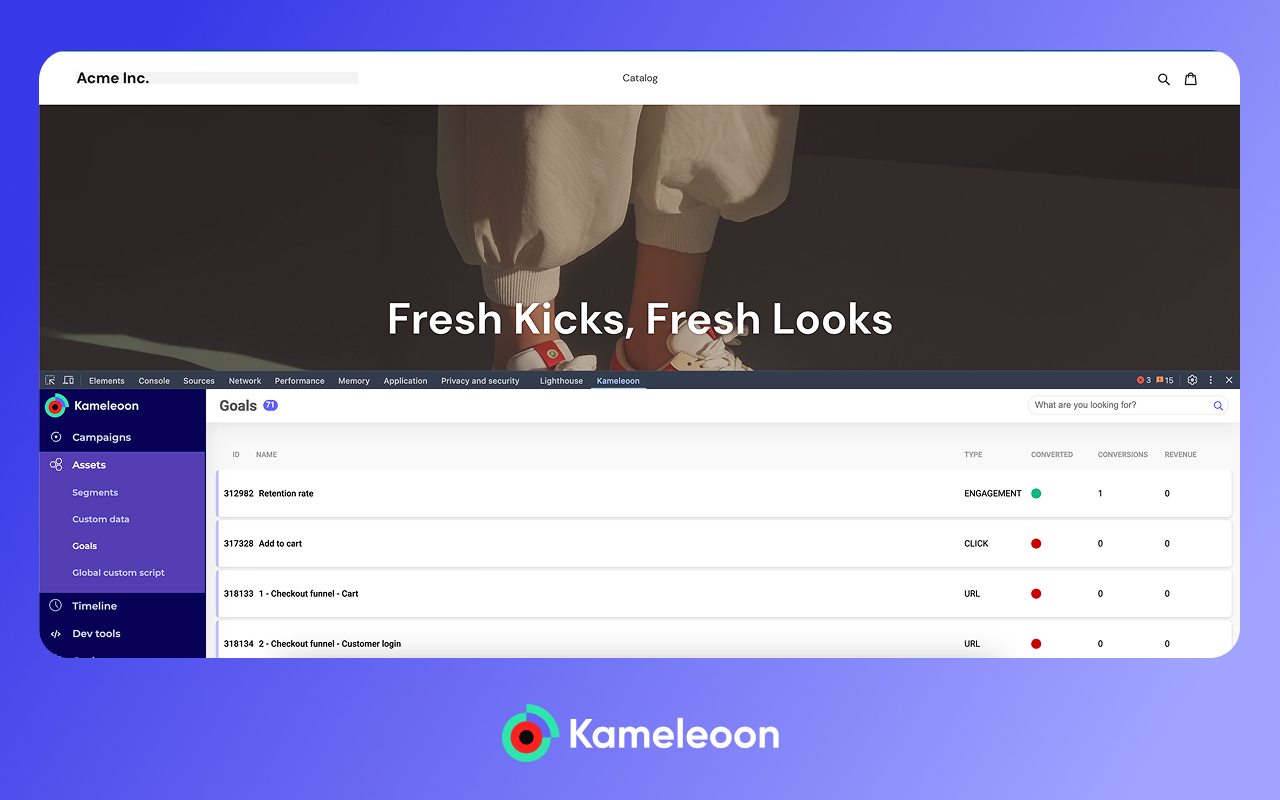
🎯 Validate goals and custom data by previewing exactly what metrics are being tracked in real time.
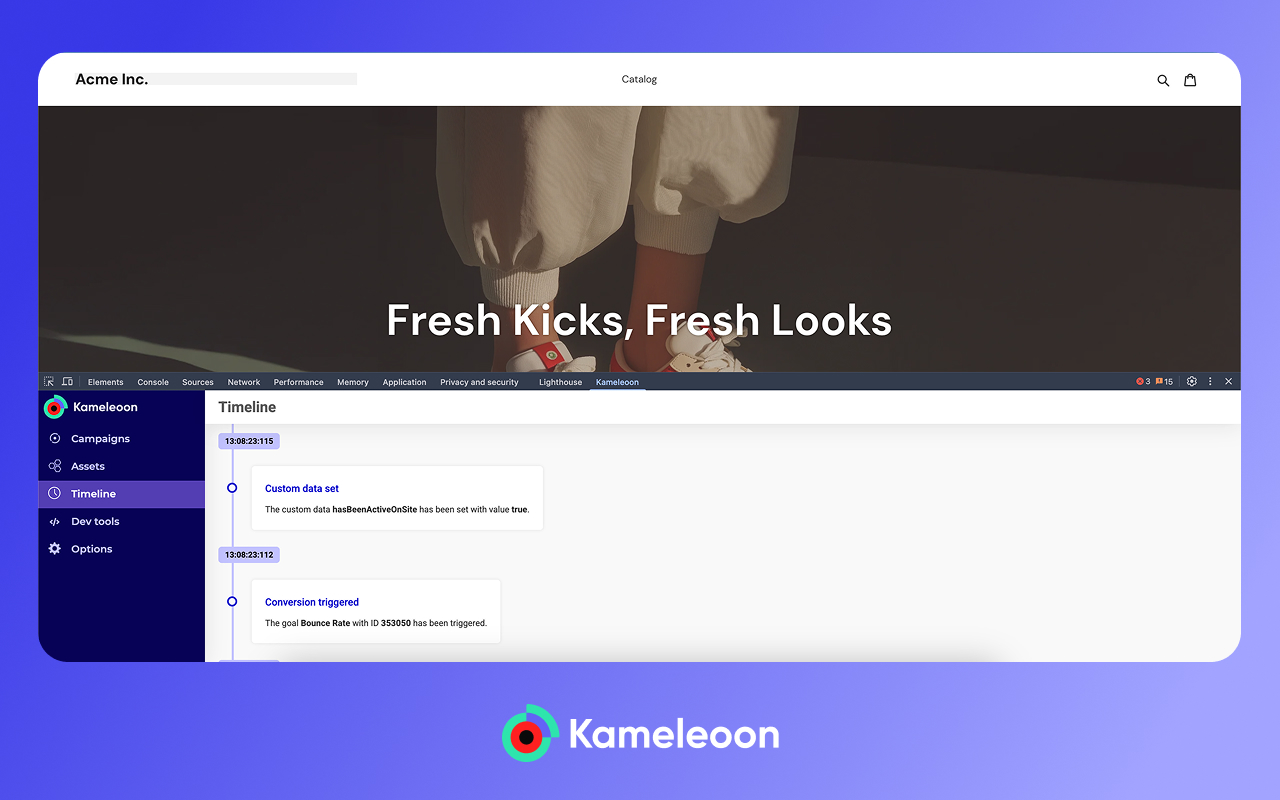
🧠 Analyze tracking calls directly from your network tab to confirm data is firing as expected.
🚫 Block Kameleoon tracking calls when you need a clean, isolated test environment.
🧩 Customize what is contained in results tables and how they’re ordered.
✅ Verify which consent mode is applied live for full compliance visibility.
How it works:
Download the extension and click it to log in. Next, open Chrome DevTools, and click the Kameleoon tab. You’ll instantly see what’s live and how your setup is performing — right inside your browser.
💡 Note: This extension is for live-site diagnostics. To simulate campaigns before going live, use Kameleoon’s built-in simulation tool.
Whether you’re a developer, QA engineer, or optimization specialist, the Kameleoon Chrome extension gives you the tools to troubleshoot issues, confirm behavior, and debug live Kameleoon activity without leaving your browser.
What you can do:
🔍 Instantly view active experiments, feature flags, and personalization campaigns — and see which variation you’re bucketed into on any page.
📦 Check script size and understand the performance impact of each component.
🎯 Validate goals and custom data by previewing exactly what metrics are being tracked in real time.
🧠 Analyze tracking calls directly from your network tab to confirm data is firing as expected.
🚫 Block Kameleoon tracking calls when you need a clean, isolated test environment.
🧩 Customize what is contained in results tables and how they’re ordered.
✅ Verify which consent mode is applied live for full compliance visibility.
How it works:
Download the extension and click it to log in. Next, open Chrome DevTools, and click the Kameleoon tab. You’ll instantly see what’s live and how your setup is performing — right inside your browser.
💡 Note: This extension is for live-site diagnostics. To simulate campaigns before going live, use Kameleoon’s built-in simulation tool.