应用截图

详细介绍
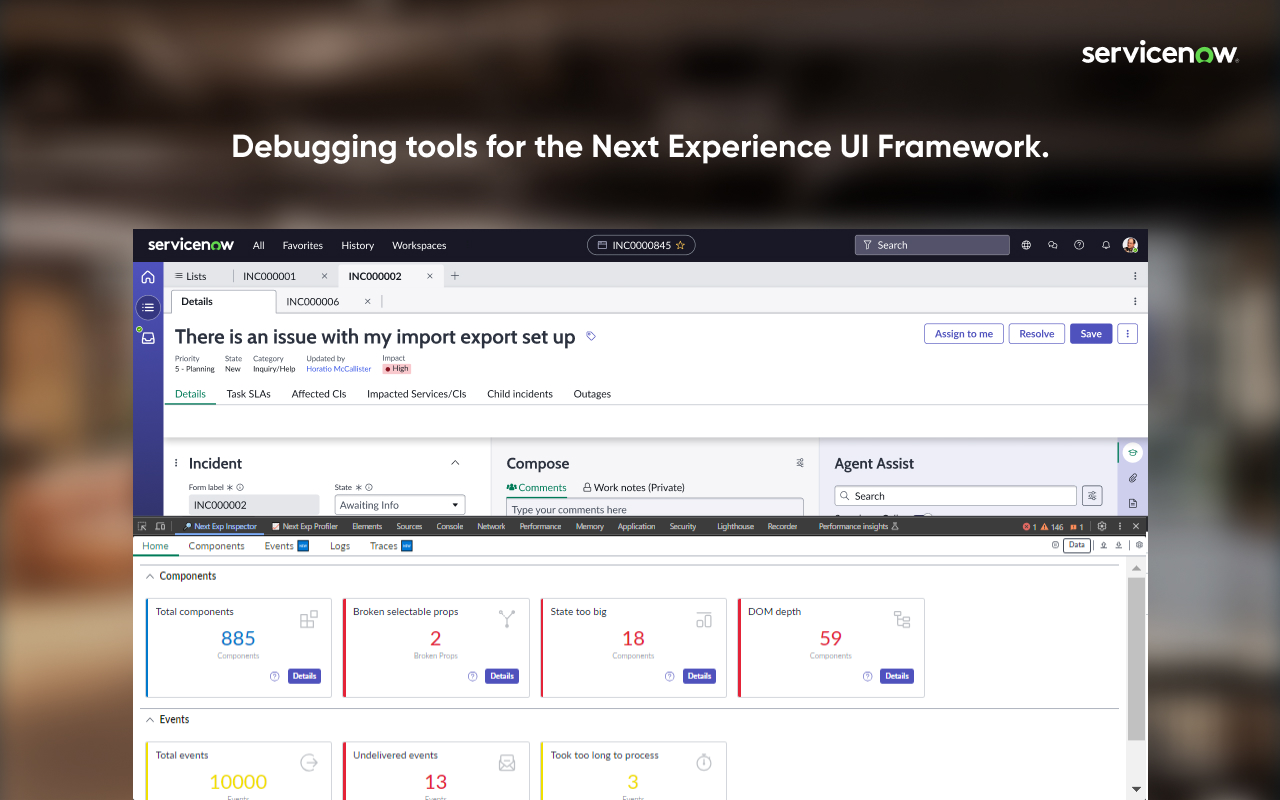
Debugging/Profiling tools for your ServiceNow Next Experiences.
The extension is composed of two panels: Next Exp Inspector and Next Exp Profiler.
The Next Exp Inspector has the capability to observe page behavior and access component details via seven distinct tabs.
• Home: view indicators to help identify areas of improvement
• Components: analyze the DOM tree and inspect a component’s properties, state and actions.
• Events: view a list of events occurring in a page and generate a new custom event when needed for testing.
• Traces: view interactions of a page and an execution hierarchy to see relationship between items and their duration
• Logs: view a list of logs that have been emitted across the page.
• Versions: a list of all asset versions on the instance
• Service Workers: debugging service worker info on the instance
Next Exp Profiler allows you to create, manage, and compare profiles for optimizing page performance proactively.
• Profile: view detailed information about the page execution to understand its performance and opportunities for optimizations.
• Compare: See what has changed between two profiles by viewing differences across different event types. This helps identify areas of focus when troubleshooting performance degradation.
Right-click and use "ServiceNow Tools" to navigate to UI Builder and other builders from the current page.