应用截图
详细介绍
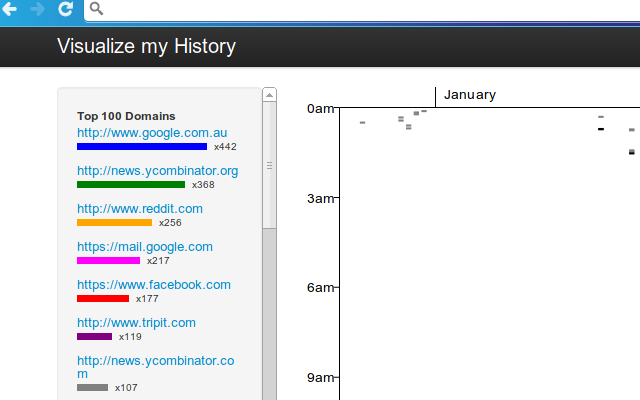
Visualize your browsing history with a scattergraph of all your browsing.
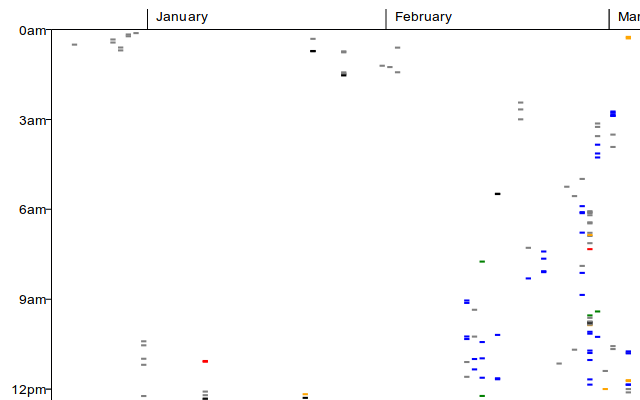
See what sites you visit the most, and what times you spent on which sites. Visualise your entire browsing history on one graph.
Graphs are plotted by time of day vs day, and colored by hostname.
See what sites you visit the most, and what times you spent on which sites. Visualise your entire browsing history on one graph.
Graphs are plotted by time of day vs day, and colored by hostname.