应用截图
详细介绍
Extract SOQL queries with their execution counts from Debug Logs of Salesforce. Helps you analyze the 'Too Many SOQLs' error.
Update 2.0.0.0:
Works only with Classic mode of Salesforce. Users complained about not being able to install the extension. Updated manifest.json file so this should be resolved.
Update 0.0.0.9:
Manifest.json permissions were updated to enable the extension for lightning
Update 0.0.0.8:
Uploading the same package to make the extension available on the new version of webstore. No changes in functionality.
Update 0.0.0.5: Added two new features
1. Added an option to view nested method calls and the ability to expand and collapse them. Please note that it would display only user debug and soql statements between the method entry exits. This is a Beta release of this feature and I am looking forward for some feedback as to what are the other details that would be helpful to developers.
2. Ability to filter the log files. When the "Filter Log Type" is checked, it would show you further checkboxes which you can use to filter the contents of the log file. It would show you only those statements.
Update 0.0.0.3: The extension icon will now be visible only after you open a debug log. This is based on the best practice (memory optimization) recommended by chrome docs.
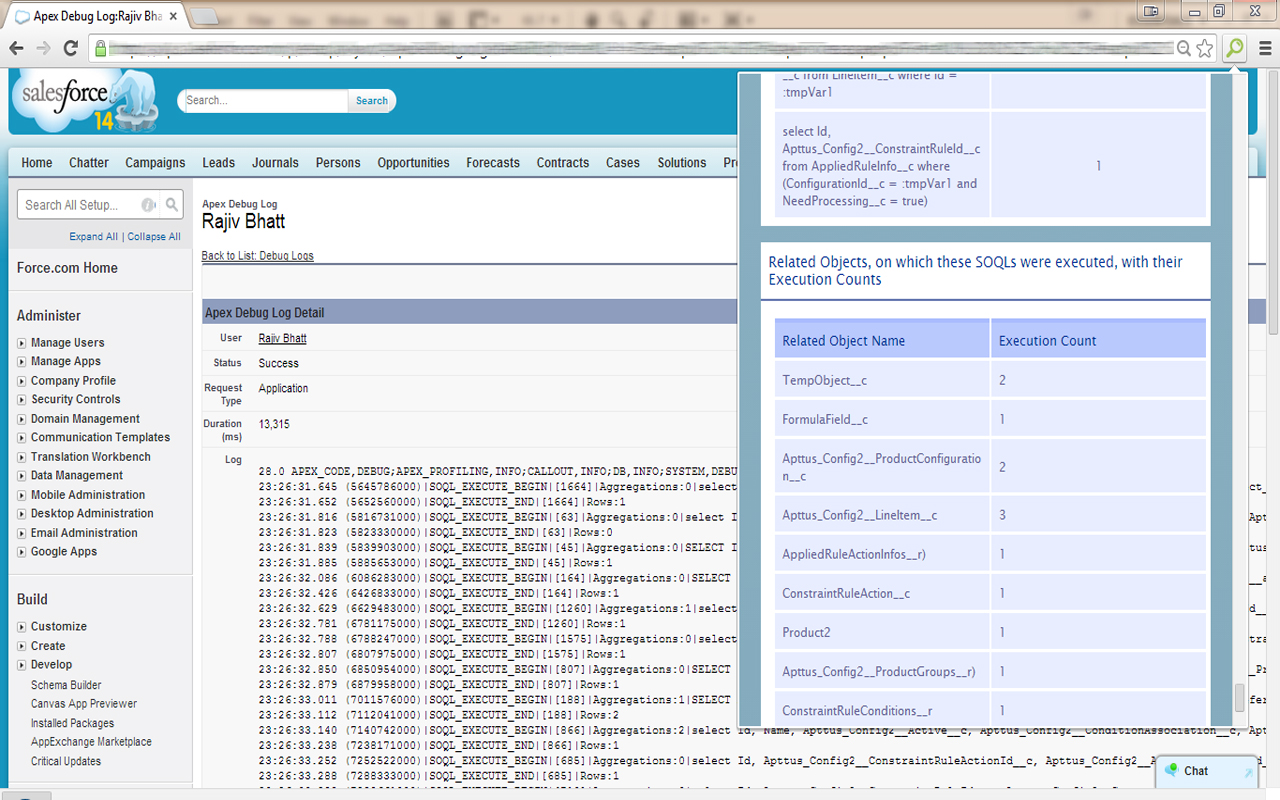
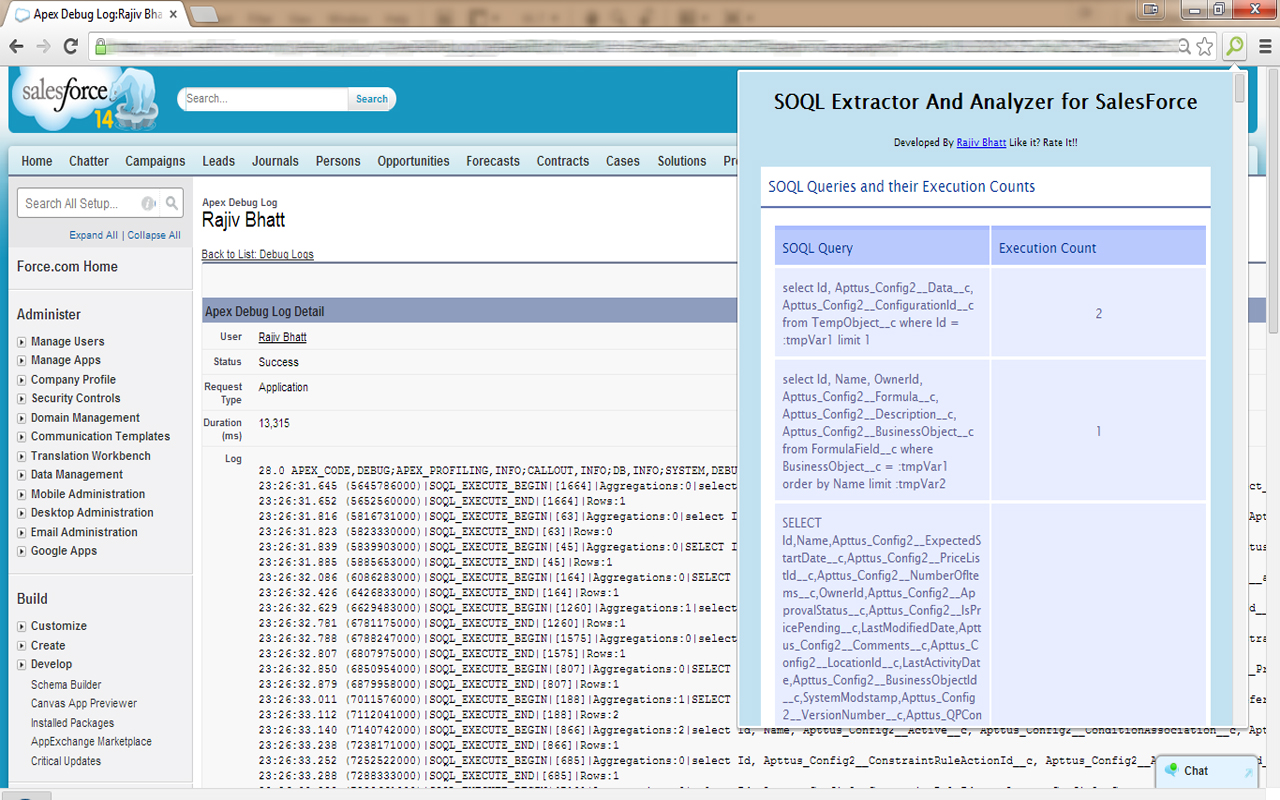
This extension helps you extract and analyze the SOQL queries from the debug logs of Salesforce. Open up any Debug Log on Salesforce and then on just "One-Click" of the extension it would display the following information:
1. All the SOQL queries along with their execution count.
2. The extension would also display all the Objects (Standard/Custom) on which these SOQL queries are executed.
For ex: If you have got queries that hit the Account object 5 times, you might want to have a relook at the code and optimize the code in a way that you get all the data from the Account object in single SOQL query (instead of querying it 5 times).
- These statistics usually help in de
Update 2.0.0.0:
Works only with Classic mode of Salesforce. Users complained about not being able to install the extension. Updated manifest.json file so this should be resolved.
Update 0.0.0.9:
Manifest.json permissions were updated to enable the extension for lightning
Update 0.0.0.8:
Uploading the same package to make the extension available on the new version of webstore. No changes in functionality.
Update 0.0.0.5: Added two new features
1. Added an option to view nested method calls and the ability to expand and collapse them. Please note that it would display only user debug and soql statements between the method entry exits. This is a Beta release of this feature and I am looking forward for some feedback as to what are the other details that would be helpful to developers.
2. Ability to filter the log files. When the "Filter Log Type" is checked, it would show you further checkboxes which you can use to filter the contents of the log file. It would show you only those statements.
Update 0.0.0.3: The extension icon will now be visible only after you open a debug log. This is based on the best practice (memory optimization) recommended by chrome docs.
This extension helps you extract and analyze the SOQL queries from the debug logs of Salesforce. Open up any Debug Log on Salesforce and then on just "One-Click" of the extension it would display the following information:
1. All the SOQL queries along with their execution count.
2. The extension would also display all the Objects (Standard/Custom) on which these SOQL queries are executed.
For ex: If you have got queries that hit the Account object 5 times, you might want to have a relook at the code and optimize the code in a way that you get all the data from the Account object in single SOQL query (instead of querying it 5 times).
- These statistics usually help in de