应用截图
详细介绍
Troubleshoot analytics tags, variables, events, cookies, and more. Supports Adobe Analytics, Google Analytics, and thousands more.
ObservePoint Debugger — Analytics, Tag & Cookie Inspector
Now with a new Cookies tab!
Easily view, search, and manage all browser cookies — a perfect replacement for the discontinued Awesome Cookie Manager.
Overview
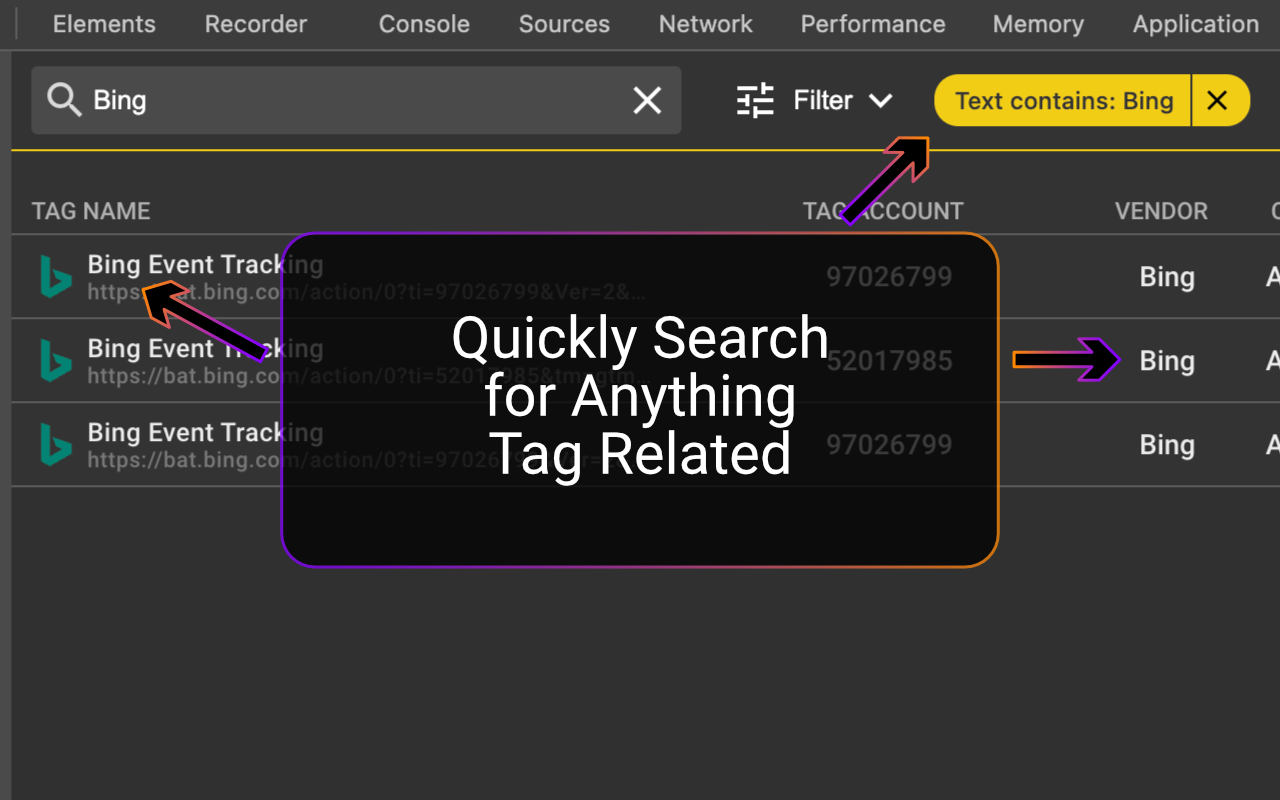
ObservePoint’s Debugger is a free Chrome Extension for troubleshooting analytics, marketing tags, and cookies directly in Chrome DevTools. It captures page-load and event-triggered requests, parsing them into a clean, human-readable format for easy debugging.
New Cookies Tab
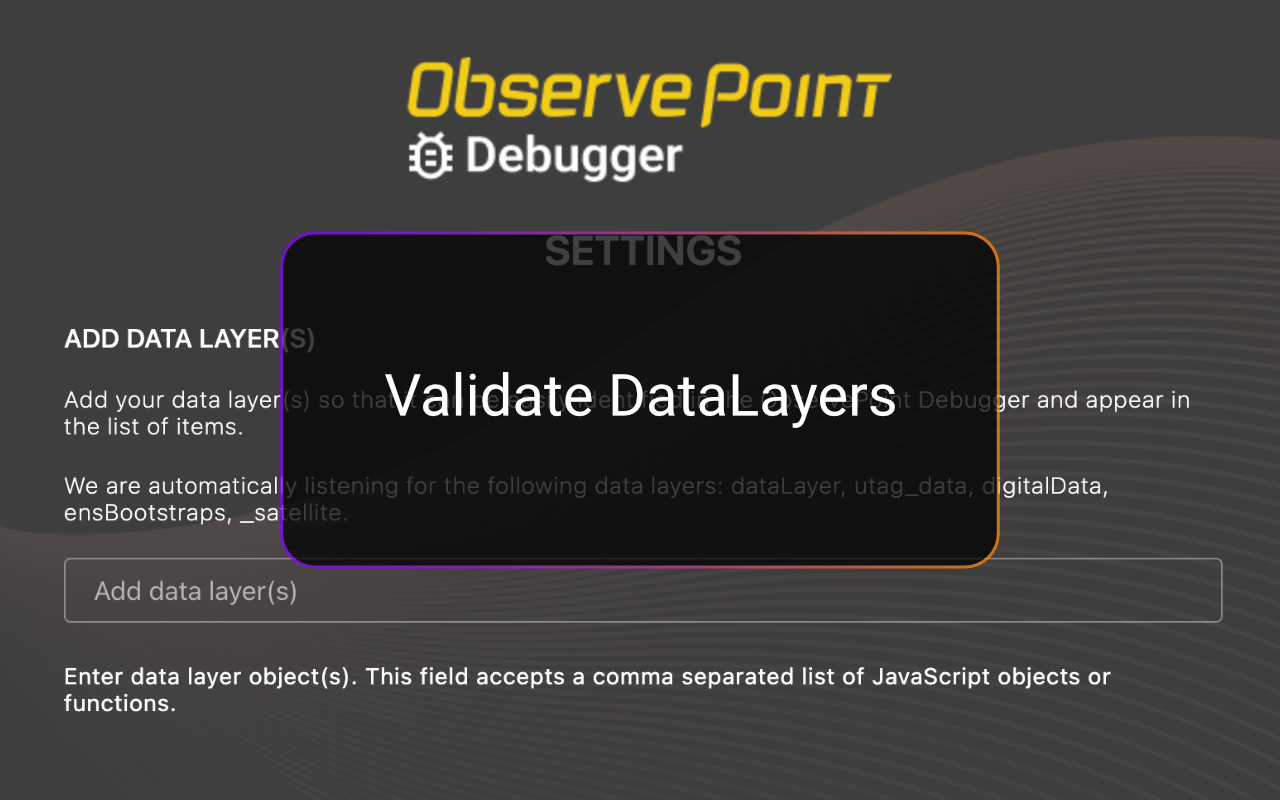
Quickly inspect all browser cookies in one place — including those set by tags and scripts. Filter and sort by name, value, domain, path, expiration, and more to understand cookie behavior and privacy implications.
Why Use ObservePoint Debugger
ObservePoint’s Debugger is the first step toward comprehensive governance of analytics, tags, and cookies. The full ObservePoint platform helps you:
🔹 Scan pages or user flows for data accuracy
🔹 Monitor live analytics implementations for errors
🔹 Test in dev and staging environments before release
🔹 Simulate user journeys to validate conversion paths
🔹 Identify cookies set by tags and scripts
🔹 Get alerts when tracking or compliance fails
👉 Get a free account: https://app.observepoint.com/sign-up
⸻
How It Works
After installation, open Chrome DevTools → ObservePoint tab → refresh the page.
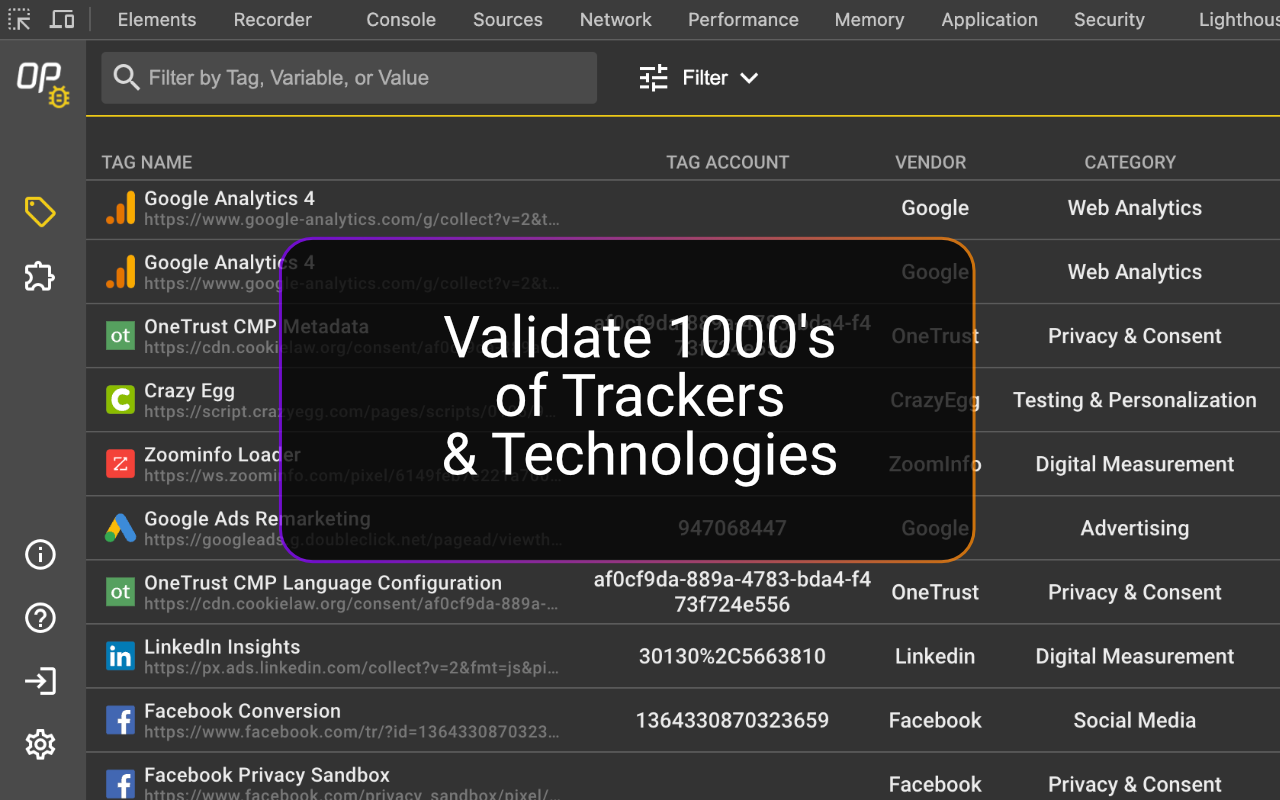
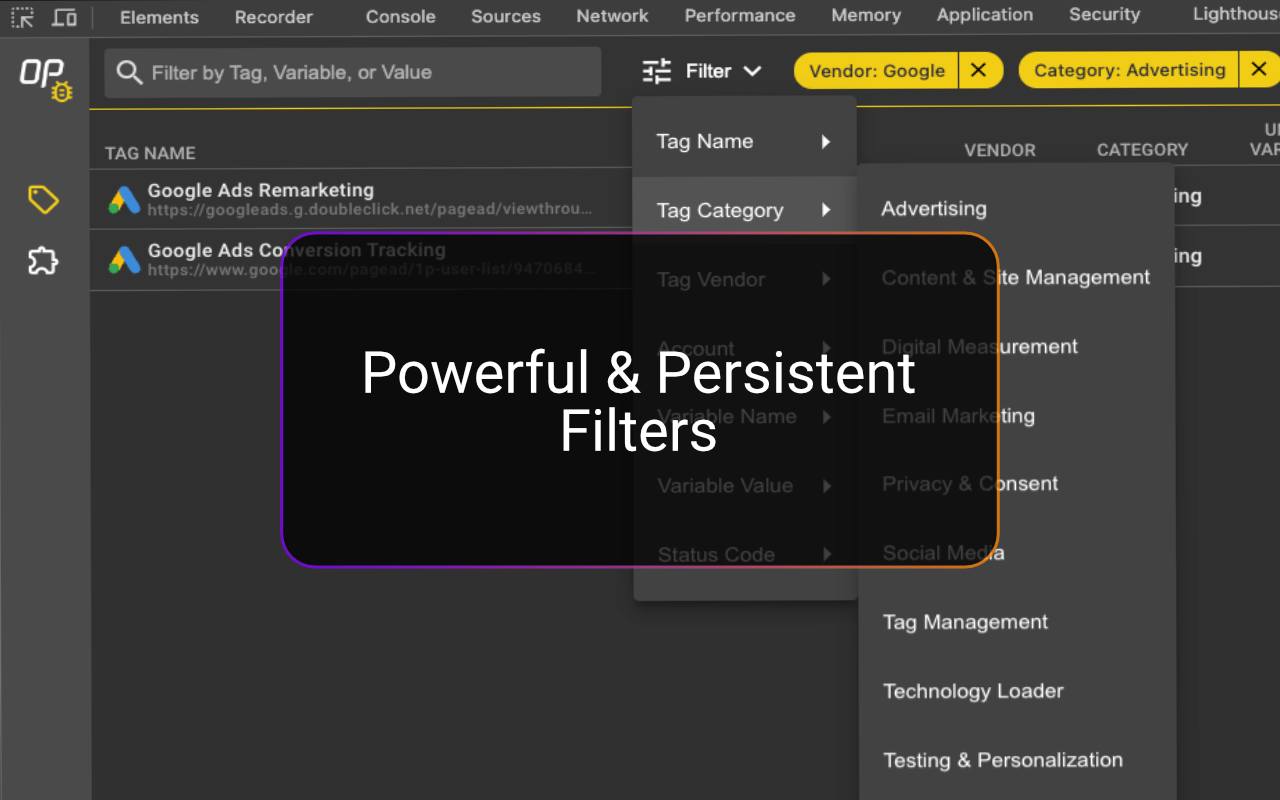
See which tags and cookies fire, including:
🔅 Tag Name (e.g., GA4, Adobe Analytics, OneTrust, and thousands more)
🔅 Account (e.g., G-299302931)
🔅 Category (Analytics, Advertising, Tag Management)
🔅 Status, Request Size, Response Size, Latency
🔅 Cookies Set by Tags
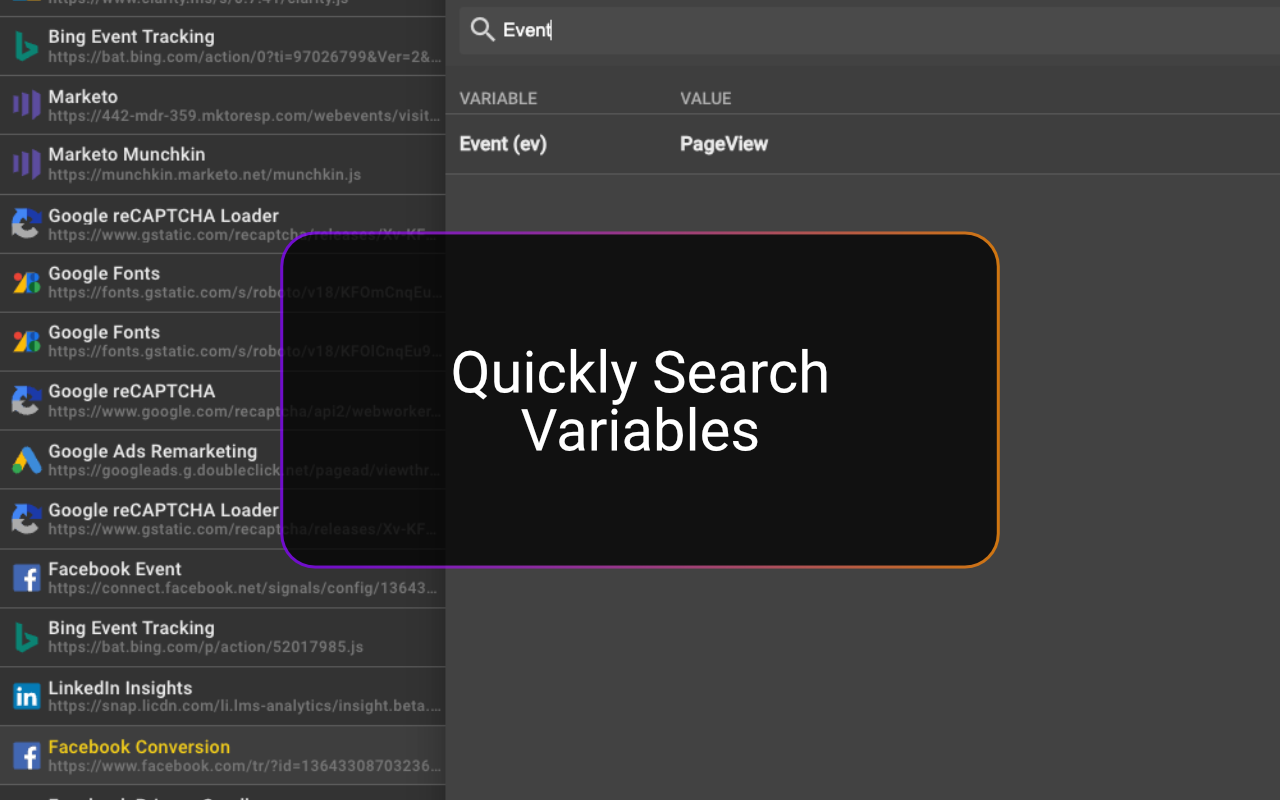
Click any tag to view variables, cookies, and decoded request data. Clear logs anytime or export data as an Excel file (OP_Debugger_Results_[DATE].xlsx).
⸻
Get Started
Debugger is an excellent alternative to WASP, Charles, Fiddler, OmniBug, Adobe Debugger, or Tag Inspector.
1. Enable the extension under Chrome → More Tools → Extensions
2. Open DevTools (Ctrl+Shift+I / Cmd+Opt+I)
3. Select the ObservePoint tab
4. Refresh your page
5. Start debugging!
By installing, you agree to the ObservePoint Terms of Service: https://www.observepoint.com/service-agreement/
Learn more: https://help.observepoint.com/en/articles/9113174-observepoint-debugger-chrome-extension
ObservePoint Debugger — Analytics, Tag & Cookie Inspector
Now with a new Cookies tab!
Easily view, search, and manage all browser cookies — a perfect replacement for the discontinued Awesome Cookie Manager.
Overview
ObservePoint’s Debugger is a free Chrome Extension for troubleshooting analytics, marketing tags, and cookies directly in Chrome DevTools. It captures page-load and event-triggered requests, parsing them into a clean, human-readable format for easy debugging.
New Cookies Tab
Quickly inspect all browser cookies in one place — including those set by tags and scripts. Filter and sort by name, value, domain, path, expiration, and more to understand cookie behavior and privacy implications.
Why Use ObservePoint Debugger
ObservePoint’s Debugger is the first step toward comprehensive governance of analytics, tags, and cookies. The full ObservePoint platform helps you:
🔹 Scan pages or user flows for data accuracy
🔹 Monitor live analytics implementations for errors
🔹 Test in dev and staging environments before release
🔹 Simulate user journeys to validate conversion paths
🔹 Identify cookies set by tags and scripts
🔹 Get alerts when tracking or compliance fails
👉 Get a free account: https://app.observepoint.com/sign-up
⸻
How It Works
After installation, open Chrome DevTools → ObservePoint tab → refresh the page.
See which tags and cookies fire, including:
🔅 Tag Name (e.g., GA4, Adobe Analytics, OneTrust, and thousands more)
🔅 Account (e.g., G-299302931)
🔅 Category (Analytics, Advertising, Tag Management)
🔅 Status, Request Size, Response Size, Latency
🔅 Cookies Set by Tags
Click any tag to view variables, cookies, and decoded request data. Clear logs anytime or export data as an Excel file (OP_Debugger_Results_[DATE].xlsx).
⸻
Get Started
Debugger is an excellent alternative to WASP, Charles, Fiddler, OmniBug, Adobe Debugger, or Tag Inspector.
1. Enable the extension under Chrome → More Tools → Extensions
2. Open DevTools (Ctrl+Shift+I / Cmd+Opt+I)
3. Select the ObservePoint tab
4. Refresh your page
5. Start debugging!
By installing, you agree to the ObservePoint Terms of Service: https://www.observepoint.com/service-agreement/
Learn more: https://help.observepoint.com/en/articles/9113174-observepoint-debugger-chrome-extension